

A Quantitative Risk Assessment (QRA) is a systematic process safety study used to estimate the likelihood and potential consequences of hazardous events in numerical terms. It combines information about how often an incident scenario may occur with what could happen if it occurs, allowing risk to be quantified and compared with defined risk criteria where applicable.
In a process plant, QRA can help answer questions that qualitative studies alone may not fully resolve:
How often could a major release occur? How far could its consequences extend? Who could be affected? What is the resulting level of risk? Would a proposed design change materially reduce that risk?
A QRA does not simply produce a colourful risk contour or a number in a report. A credible study follows a chain of engineering reasoning from process hazards and initiating events through frequency analysis, consequence modelling, exposure and vulnerability, and finally risk estimation.
The Center for Chemical Process Safety (CCPS) describes chemical process quantitative risk analysis as a methodology for identifying incident scenarios and evaluating their risk by considering failure probabilities, consequences and potential impacts.
This guide explains how that process works, what goes into a QRA, how individual and societal risk are represented, how QRA differs from HAZOP and LOPA, and what the results can and cannot tell you.
What is Quantitative Risk Assessment?
Quantitative Risk Assessment is a structured methodology for estimating risk numerically by combining the frequency or probability of hazardous scenarios with their consequences.
At a conceptual level:
Risk = Frequency × Consequence
In an actual QRA, however, risk is rarely represented by one simple multiplication. A study may contain many initiating events, release cases, weather conditions, ignition outcomes, escalation pathways, exposure conditions and consequence levels. The final risk is therefore built from the contribution of multiple scenarios.
CCPS guidance covers consequence analysis, event probability and failure frequency analysis, calculation and presentation of risk estimates, databases, reliability considerations and other specialised techniques within the broader CPQRA methodology.
What does QRA quantify?
Depending on the purpose and scope of the study, a QRA may quantify:
- Frequency of hazardous events
- Release frequencies
- Consequence distances
- Toxic exposure
- Thermal radiation
- Explosion overpressure
- Flash fire effects
- Potential fatalities
- Individual risk
- Societal risk
- Risk contours
- Frequency versus number of fatalities
- Contributions from different accident scenarios
- The potential effect of proposed risk reduction measures
Not every QRA needs all of these outputs.
The scope should be determined by the hazard, the decision that the study needs to support, the available information and the applicable regulatory or company requirements.
Why is QRA needed in process safety?
A process facility can contain hundreds of potential hazardous scenarios.
A storage tank may fail.
A pipeline may rupture.
A pump seal may leak.
A vessel may overpressure.
A toxic material may escape from a flange.
A flammable vapour cloud may form and ignite.
A release may remain local, or under certain conditions it may affect people outside the immediate process area.
A HAZOP can systematically identify deviations and their possible causes and consequences. A LOPA can examine specific scenarios and evaluate independent protection layers.
But some decisions require another level of analysis.
For example:
Would moving an occupied building 100 metres farther from a process unit materially change the risk?
Or:
Is the risk contribution from a large storage vessel dominated by toxic release, fire or explosion scenarios?
Or:
Would an additional isolation system significantly reduce the overall risk?
These questions require more than simply assigning a qualitative risk ranking.
QRA provides a framework for quantifying the relevant scenarios so that alternative decisions can be compared on an engineering basis.
CCPS describes QRA as particularly useful where qualitative analysis cannot provide sufficient understanding and where additional information is needed for risk management and evaluation of alternative risk reduction strategies.
QRA is more than consequence modelling
One of the most common misunderstandings about QRA is treating it as another name for dispersion modelling.
It is not.
Dispersion modelling is one component of consequence analysis.
A complete QRA may involve:
Hazard identification → Scenario development → Frequency analysis → Release modelling → Consequence modelling → Exposure and vulnerability → Risk calculation → Risk presentation → Risk reduction
Dispersion modelling may determine how a toxic or flammable cloud develops after a release.
But the QRA still needs to establish:
- How frequently the release scenario could occur
- What release cases need to be considered
- What weather conditions are relevant
- Whether ignition occurs
- What consequences result
- Who may be exposed
- What level of harm could occur
- How the scenario contributes to overall risk
This distinction is important when defining the scope of a QRA study.
How does a Quantitative Risk Assessment work?
A credible QRA is normally developed through a sequence of connected engineering activities.
The exact workflow varies with the facility and study objective, but the following structure represents a typical process safety QRA.
1. Define the QRA scope and objectives
The first question should not be:
“Which software will we use?”
It should be:
“What decision does this QRA need to support?”
The scope may be related to:
- New plant design
- Expansion or debottlenecking
- Facility siting
- Storage capacity changes
- Process modification
- Risk reduction
- Emergency planning
- Regulatory assessment
- Land use planning
- Occupied building assessment
- Comparison of design alternatives
- Major accident hazard evaluation
The study boundary, hazardous materials, equipment, population, operating conditions and required risk metrics should be established before detailed modelling begins.
A poorly defined scope can produce technically sophisticated calculations that answer the wrong question.
2. Collect and validate input data
QRA quality depends heavily on the quality of its inputs.
Typical information may include:
- Process flow diagrams
- Piping and instrumentation diagrams
- Process descriptions
- Equipment datasheets
- Material inventories
- Operating pressure and temperature
- Composition and physical properties
- Storage conditions
- Pipe sizes
- Relief system information
- Isolation arrangements
- Detection and shutdown systems
- Layout drawings
- Equipment locations
- Drainage arrangements
- Meteorological data
- Site topography where relevant
- Occupancy information
- Population distribution
- Operating and maintenance information
- Historical incident or reliability information
- Existing protection systems
The objective is not simply to collect documents. The information must be checked for consistency with the actual design and operating basis.
A QRA based on outdated process conditions can produce highly precise numbers that are nevertheless misleading.
3. Identify hazardous scenarios
The next step is to determine which accident scenarios should be quantified.
Scenario development may consider events such as:
- Loss of containment
- Equipment failure
- Pipeline rupture
- Small leaks
- Large releases
- Overpressure
- Tank failure
- Utility failure
- Loss of cooling
- Loss of containment followed by ignition
- Toxic material release
- Escalation or domino effects where relevant
Scenario identification can draw on HAZOP, HAZID, PHA, historical data, equipment failure information, previous studies and engineering judgement.
This is one reason QRA should not be treated as a completely isolated exercise.
The quality of the scenarios entering the model directly influences the quality of the final risk estimate.
4. Determine initiating event frequencies
Once scenarios have been identified, the analyst needs to estimate how frequently the initiating events may occur.
Sources can include:
- Plant specific data
- Industry databases
- Published failure frequency data
- Equipment reliability information
- Historical incident data
- Fault tree analysis
- Event tree analysis
- Human reliability analysis where appropriate
- Engineering judgement supported by documented assumptions
This is often one of the most challenging parts of QRA.
A number such as:
1 × 10⁻⁵ events per year
looks extremely precise.
But the underlying estimate may depend on generic data, assumptions, equipment configuration, operating environment and data quality.
Therefore, QRA results should not be interpreted as predictions with unlimited precision.
The numerical result is an engineering estimate based on a defined model, evidence and assumptions.
5. Develop release scenarios
For loss of containment scenarios, the analyst may need to establish different release cases.
These can include different:
- Leak sizes
- Hole sizes
- Rupture cases
- Release orientations
- Release durations
- Isolation times
- Inventory availability
- Initial conditions
- Phase behaviour
A small leak and a full-bore rupture may produce very different consequences.
The study therefore needs to capture the release cases that are relevant to the equipment and decision being evaluated.
6. Perform consequence analysis
Consequence modelling determines what could happen following the initiating event.
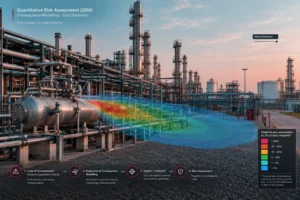
Depending on the material and scenario, this may include:
Toxic release
A toxic release may require modelling of:
- Release rate
- Dispersion
- Atmospheric conditions
- Concentration versus distance
- Exposure duration
- Toxicity criteria
Flammable release
A flammable release may lead to several possible outcomes depending on the material, release characteristics and ignition conditions.
Potential outcomes can include:
- Jet fire
- Flash fire
- Pool fire
- Vapour cloud explosion
- Fireball or BLEVE type scenarios where technically applicable
The analyst should not assume that every flammable release produces every possible outcome.
The scenario tree and modelling assumptions must reflect the physical situation.
Explosion
Where an explosion scenario is credible, analysis may consider:
- Explosion mechanism
- Congestion and confinement
- Flammable cloud characteristics
- Ignition assumptions
- Overpressure
- Impulse
- Potential damage or injury
Thermal radiation
Fire scenarios may require calculation of thermal radiation and its variation with distance and orientation.
The resulting effects can then be considered in the exposure and vulnerability assessment.
7. Consider weather and environmental conditions
Atmospheric conditions can significantly influence the consequences of a release.
For dispersion studies, relevant factors can include:
- Wind speed
- Wind direction
- Atmospheric stability
- Temperature
- Atmospheric pressure
- Surface characteristics
- Site specific meteorological distributions
A single weather condition cannot necessarily represent all operating conditions.
A robust QRA may therefore evaluate multiple representative weather conditions and their frequencies.
The resulting risk can then reflect the contribution of different meteorological states rather than relying on one convenient modelling case.
8. Model ignition and event progression
For flammable releases, the outcome can depend strongly on what happens after the material is released.
For example:
Release → Dispersion → Delayed ignition
may result in a flash fire or explosion depending on the scenario.
Whereas:
Release → Immediate ignition
may result in a jet fire or pool fire.
QRA therefore uses event progression logic to represent different possible outcomes.
This is where event trees and related modelling techniques can become important.
The objective is not to assume one outcome. It is to quantify credible pathways and their relative contributions.
9. Evaluate exposure and vulnerability
A consequence does not automatically equal a fatality.
A thermal radiation contour, toxic concentration or explosion overpressure level describes a physical effect.
Risk analysis must then consider who or what may be exposed to that effect and with what consequence.
Depending on the study, this can involve:
- Onsite personnel
- Contractors
- Visitors
- Offsite population
- Occupancy patterns
- Personnel movement
- Shelter or evacuation assumptions
- Exposure duration
- Vulnerability relationships
For toxic effects, vulnerability may be represented using appropriate dose or probit based approaches where applicable.
For fire and explosion scenarios, suitable consequence and vulnerability relationships may be applied.
The exact methodology should be appropriate to the hazard and supported by the study basis.
10. Calculate risk
The individual scenario results are then combined to estimate the selected risk metrics.
Conceptually, each scenario contributes according to:
How often can it happen?
and
What happens when it does?
A high consequence scenario that is extremely unlikely may contribute differently to overall risk than a less severe scenario that occurs more frequently.
This is one of the fundamental strengths of QRA.
It moves the discussion from:
“This scenario is severe.”
to:
“How does this scenario contribute to the overall risk?”
11. Present the risk results
The results can be presented in several ways depending on the objective.
Common outputs include:
- Individual risk
- Individual risk contours
- Societal risk
- F N curves
- Scenario frequency tables
- Consequence distances
- Risk contribution by scenario
- Risk contribution by equipment
- Risk contribution by hazard type
- Sensitivity results
- Risk reduction comparisons
Not every QRA requires every output.
HSE specifically notes that quantitative assessment does not automatically mean that a detailed analysis producing isorisk contours and F/N societal risk curves is required in every case. The extent and form of quantification should reflect the circumstances and proportionality of the assessment.
What is individual risk in QRA?
Individual risk describes the risk to an individual at a specified location from the hazardous activities being assessed.
In practical QRA applications, individual risk is commonly presented geographically as risk contours.
For example, a contour may represent locations where the estimated annual risk reaches a particular value.
This allows engineers and decision makers to see how risk varies spatially around a facility.
A risk contour can therefore help answer questions such as:
- Does an occupied building lie within a significant risk region?
- How does the risk extend beyond the site boundary?
- How would relocating an occupied area change exposure?
- Which areas of the facility contribute most to personnel risk?
The exact definition and criteria applied to individual risk depend on the study framework and jurisdiction.
A risk contour should therefore never be interpreted without understanding the underlying assumptions, criteria and methodology.
What is societal risk?
Societal risk considers the relationship between the frequency of accidents and the number of people who could be affected.
It is commonly represented using an F N curve.
Here:
F represents the cumulative frequency of accidents involving N or more fatalities, while N represents the number of fatalities.
An F N curve can therefore show how frequently scenarios of different potential fatality sizes may occur.
This becomes particularly relevant where a facility is located near significant populations.
Societal risk and individual risk answer different questions.
Individual risk asks:
“What is the estimated risk to an individual at a particular location?”
Societal risk asks:
“How does accident frequency relate to the potential number of people affected?”
Neither metric should automatically be treated as a complete description of facility risk.
What are risk contours?
A risk contour is a line on a site or geographic map connecting locations having the same estimated level of individual risk.
Think of it as a topographic map for risk.
Instead of showing elevation, it shows how estimated risk changes across the surrounding area.
For example, different contours might represent different annual individual risk levels.
Risk contours can be useful for:
- Facility layout decisions
- Occupied building siting
- Separation distance assessment
- Land use planning
- Emergency planning
- Comparing design alternatives
However, contours are model outputs.
They should not be interpreted as physical boundaries where danger suddenly begins or ends.
Risk changes continuously, while the contour is simply a way of visualising selected levels.
What is an F N curve?
An F N curve is a graphical representation of societal risk.
It plots:
- F, the cumulative frequency of accidents causing N or more fatalities
- N, the number of fatalities
The curve allows analysts to examine both relatively frequent lower consequence scenarios and much less frequent scenarios with potentially larger numbers of fatalities.
This distinction is important because two facilities could potentially have similar individual risk while having different societal risk profiles.
That is why a mature QRA should select risk measures based on the decision being supported rather than treating one metric as sufficient for every application.
What information is required for a QRA?
A QRA may require a substantial amount of technical information.
Process information
- Process description
- PFDs
- P&IDs
- Operating conditions
- Process chemistry
- Equipment inventories
- Pressure and temperature
- Flow rates
- Material properties
Equipment information
- Equipment types
- Dimensions
- Capacities
- Pipe sizes
- Relief devices
- Isolation systems
- Detection systems
- Shutdown systems
Layout information
- Plot plan
- Equipment locations
- Buildings
- Roads
- Battery limits
- Drainage
- Fire protection facilities
- Occupied areas
Site information
- Meteorological data
- Terrain
- Surrounding land use
- Nearby facilities
- Population
- Sensitive locations
Safety information
- Detection systems
- Emergency shutdown systems
- Isolation arrangements
- Fire protection
- Emergency response provisions
- Operating procedures
- Relevant protection layers
The exact data requirements depend on the QRA scope.
What scenarios are commonly considered in QRA?
The scenarios depend heavily on the facility and materials involved.
Typical process safety QRA scenarios can include:
Loss of containment
- Small leaks
- Medium releases
- Large releases
- Full bore ruptures
- Vessel failures
- Pipeline failures
- Tank releases
Fire scenarios
- Jet fire
- Pool fire
- Flash fire
- Fireball where applicable
Explosion scenarios
- Vapour cloud explosion
- Confined or partially confined explosion scenarios where relevant
- Other explosion mechanisms depending on the process
Toxic scenarios
- Toxic gas release
- Toxic vapour release
- Toxic liquid release followed by evaporation
Escalation scenarios
Where credible, the study may also consider:
- Fire escalation
- Explosion escalation
- Domino effects
- Secondary equipment failures
The important point is that scenario selection must be technically justified.
A QRA should not become a checklist exercise where every imaginable accident is inserted into a model without considering whether it is physically credible.
QRA methodology: what makes a study credible?
The software used for QRA is only one part of the study.
A credible QRA depends on the engineering basis behind the model.
1. Defensible scenarios
The accident scenarios should have a clear connection to the process, equipment and credible failure mechanisms.
2. Appropriate frequency data
Frequency estimates should come from suitable sources and should be applied consistently with their definitions and limitations.
3. Physically meaningful consequence models
The model should reflect the actual release, material behaviour, process conditions and environment.
4. Transparent assumptions
Important assumptions should be documented rather than hidden inside the model.
5. Appropriate risk metrics
The selected outputs should answer the decision the QRA was commissioned to support.
6. Sensitivity analysis
Where uncertainty in important assumptions could materially affect the conclusion, sensitivity analysis can help identify which assumptions matter most.
7. Engineering review
Results should be reviewed by competent process safety and engineering professionals who understand both the facility and the limitations of the modelling approach.
A technically polished graph does not compensate for weak input assumptions.
Why uncertainty matters in QRA
A QRA produces numbers, but that does not mean the numbers are exact.
Uncertainty can enter through:
- Failure frequencies
- Equipment reliability
- Release sizes
- Isolation times
- Weather conditions
- Ignition probabilities
- Population data
- Occupancy assumptions
- Physical property data
- Consequence models
- Vulnerability relationships
- Human response
- Model simplifications
There can also be uncertainty about the model itself.
This is why QRA results should be interpreted as engineering estimates under defined assumptions, not as precise predictions of future accidents.
Sensitivity analysis can be particularly useful when a decision depends strongly on one or two assumptions.
For example, if changing an isolation time from one value to another significantly changes the risk result, that assumption deserves engineering attention.
QRA and ALARP
In jurisdictions and regulatory frameworks where ALARP, or “as low as reasonably practicable,” is applicable, QRA may contribute to demonstrating whether risk has been reduced appropriately.
However, ALARP should not be reduced to:
“The QRA number is below the limit, therefore nothing else is required.”
Risk criteria, tolerability principles and ALARP demonstrations are context dependent.
The regulatory framework, applicable guidance and specific facility circumstances must be considered.
HSE material illustrates this broader approach, including the relationship between quantitative assessment and decisions concerning whether risks are ALARP.
What is the difference between HAZOP, LOPA and QRA?
These studies are related, but they answer different questions.
| Study | Primary purpose | Typical approach |
|---|---|---|
| HAZOP | Identify process deviations, causes and consequences | Qualitative |
| LOPA | Evaluate a defined scenario and its independent protection layers | Semi quantitative |
| QRA | Quantify scenario frequencies and consequences and estimate risk | Quantitative |
HAZOP asks:
What can deviate from the design intent, why could it happen, and what could happen as a result?
LOPA asks:
For this specific cause consequence scenario, which independent protection layers reduce the risk and by how much?
QRA asks:
Considering the relevant scenarios, their frequencies and their consequences, what is the resulting risk?
CCPS describes LOPA as a simplified quantitative tool and places it between qualitative PHA approaches and more detailed QRA work.
These methodologies should therefore be viewed as complementary rather than competing studies.
QRA vs HAZOP
A HAZOP is primarily a structured hazard identification technique.
It examines deviations from design intent using parameters and guide words to identify causes, consequences and safeguards.
QRA goes further into numerical estimation of frequency and consequence.
A HAZOP may identify:
High flow → vessel overfill → loss of containment → potential fire
A QRA may then quantify relevant accident scenarios associated with that loss of containment, considering frequency, release characteristics, ignition outcomes, consequences and exposed population.
This is why QRA does not replace HAZOP.
It builds on a broader understanding of the hazards and scenarios.
QRA vs LOPA
LOPA focuses on a defined accident scenario and evaluates the contribution of independent protection layers.
QRA typically considers a much broader scenario set and can represent multiple event pathways, consequence outcomes, weather conditions, population exposure and other factors.
LOPA is therefore often a useful bridge between qualitative hazard analysis and a more detailed quantitative assessment.
CCPS specifically describes LOPA as a simplified quantitative risk assessment methodology using conservative rules and order of magnitude estimates.
Is QRA required for every process plant?
No.
There is no universal rule that every process facility requires the same level of quantitative risk analysis.
The need for QRA depends on factors such as:
- Hazard potential
- Inventory
- Process conditions
- Facility complexity
- Location
- Population exposure
- Regulatory requirements
- Project stage
- Management decision being supported
- Existing risk studies
- Consequence potential
The appropriate assessment should be proportionate to the risk and the purpose of the study.
HSE guidance explicitly cautions against assuming that QRA always means a full numerical analysis with isorisk contours and F N curves.
When should a QRA be performed?
QRA can be useful at different stages of a facility lifecycle.
During concept and FEED
QRA can support:
- Site selection
- Layout decisions
- Separation distances
- Hazardous area considerations
- Preliminary risk reduction
During detailed design
It can help evaluate:
- Equipment arrangement
- Occupied buildings
- Protection systems
- Isolation philosophy
- Emergency response provisions
During modifications
QRA may help determine whether a change materially affects existing risk.
During operation
It may support:
- Risk reviews
- Major accident hazard management
- Emergency planning
- Risk reduction studies
- Facility modification decisions
The earlier major layout or design decisions are evaluated, the more opportunity there generally is to make changes without major rework.
What can QRA help an organisation decide?
A good QRA should ultimately support a decision.
Depending on the project, it may help answer:
- Is the proposed facility layout appropriate?
- Which accident scenarios contribute most to risk?
- Where should occupied buildings be located?
- Which safeguards provide the greatest risk reduction?
- Would an additional isolation system materially reduce risk?
- Which equipment contributes most to overall risk?
- What are the dominant offsite risk scenarios?
- Should additional mitigation be evaluated?
- How do alternative design options compare?
- Where should emergency response resources be prioritised?
The value of QRA is therefore not the report itself.
The value is the decision that becomes better informed because of the analysis.
Common mistakes in QRA studies
Treating software output as the answer
Software can perform calculations quickly.
It cannot decide whether the scenario basis is appropriate.
Using inappropriate failure data
A frequency value is meaningful only when its definition, equipment type, operating conditions and applicability are understood.
Ignoring small releases
Large ruptures naturally attract attention, but smaller releases can also contribute significantly to risk depending on frequency and consequences.
Assuming every release ignites
Ignition is scenario dependent. Immediate and delayed ignition can lead to different outcomes.
Using one weather condition for everything
Meteorological conditions can materially affect dispersion and therefore consequences.
Ignoring population and occupancy
A consequence distance alone does not establish societal impact.
Treating QRA numbers as exact predictions
The output reflects assumptions, models and available data.
Focusing only on the final risk contour
The most useful insight may be hidden in the scenario contribution, sensitivity analysis or assumptions behind the contour.
Using QRA as a substitute for hazard identification
A numerical model cannot compensate for incomplete scenario identification.
What are the limitations of QRA?
QRA is powerful, but it is not a crystal ball.
Its results depend on:
Data + assumptions + models + engineering judgement
If any of these are weak, the result can become misleading.
QRA also cannot eliminate uncertainty surrounding rare major accidents.
Its purpose is not to predict exactly when an accident will happen.
Its purpose is to provide a structured quantitative basis for understanding and managing risk.
That distinction matters.
A QRA should therefore be used alongside other process safety activities rather than as a standalone replacement for hazard identification, engineering design, management systems or operational controls.
How does QRA support risk reduction?
The strongest QRA studies do not stop at:
“The risk is X.”
They continue to ask:
“What is driving that risk?”
Scenario contribution analysis can identify the events that make the largest contribution to the calculated risk.
Risk reduction options can then be evaluated.
Depending on the facility, these may involve:
- Improved detection
- Faster isolation
- Additional protection layers
- Inventory reduction
- Process modification
- Improved layout
- Increased separation
- Improved containment
- Fire protection
- Emergency response improvements
- Occupied building relocation
- Procedural improvements
- Reliability improvements
The effectiveness of each option should be evaluated rather than assuming that every additional safeguard produces the same benefit.
This is where QRA becomes particularly valuable as a decision support tool.
CCPS identifies evaluation of alternative risk reduction strategies and identification of cost effective risk reduction as important applications of CPQRA.
QRA in major hazard industries
QRA can be particularly valuable where hazardous inventories and potential consequences are significant.
Applications may include:
- Oil and gas facilities
- Refineries
- Petrochemical plants
- Chemical manufacturing
- Fertilizer plants
- Bulk storage terminals
- LNG and gas facilities
- Pharmaceutical facilities handling hazardous materials
- Industrial gas facilities
- Ports and terminals
- Pipelines
- Energy facilities
The actual scope should always be determined by the hazards and decision context rather than by industry name alone.
QRA, PHA, HAZOP, LOPA and SIL: how do they fit together?
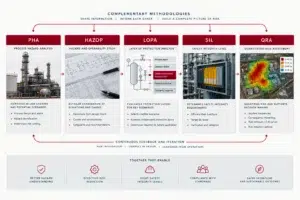
It is useful to think of process safety studies as answering different questions.
What can go wrong?
↓
Which protection layers prevent the scenario from becoming an accident, and is their risk reduction sufficient?
↓
If a safety instrumented function is required, what safety integrity is needed?
↓
QRA
Across the relevant accident scenarios, what is the resulting quantitative risk and where does it come from?
These activities can inform one another.
They should not, however, be treated as interchangeable studies.
A QRA does not replace HAZOP.
LOPA does not replace QRA.
SIL does not represent the risk of an entire plant.
Each method has a defined purpose within the broader process safety lifecycle.
What does a QRA report typically contain?
A professional QRA report may include:
1. Executive summary
Key findings, dominant scenarios and major recommendations.
2. Objectives and scope
What was assessed and why.
3. Facility description
Process, equipment, hazardous materials and site characteristics.
4. Methodology
Models, assumptions, criteria and calculation approach.
5. Hazard scenario identification
Relevant initiating events and accident scenarios.
6. Frequency analysis
Sources and methods used to estimate event frequencies.
7. Consequence analysis
Release, dispersion, fire, explosion and toxic effect modelling as applicable.
8. Risk estimation
Individual and/or societal risk calculations as applicable.
9. Risk presentation
Contours, F N curves, scenario tables and other appropriate outputs.
10. Sensitivity and uncertainty
Important assumptions and their effect on the conclusions.
11. Risk reduction recommendations
Measures considered to reduce significant risk contributors.
12. Conclusions
What the assessment means for the decision that initiated the study.
Frequently Asked Questions about QRA
What is QRA in process safety?
QRA, or Quantitative Risk Assessment, is a systematic process safety methodology that estimates the frequency and consequences of hazardous accident scenarios and combines them to quantify risk.
What is the main purpose of QRA?
The main purpose is to provide a quantitative basis for understanding risk and supporting decisions such as facility layout, risk reduction, occupied building siting, emergency planning and design changes.
Is QRA the same as dispersion modelling?
No. Dispersion modelling is one possible part of consequence analysis within a QRA. A complete QRA also considers scenario frequencies, release cases, event progression, consequences, exposure and risk estimation.
Is QRA quantitative or qualitative?
QRA is quantitative. It uses numerical estimates of event frequencies or probabilities and consequences to estimate risk.
What is the difference between HAZOP and QRA?
HAZOP primarily identifies process deviations, causes, consequences and safeguards. QRA quantitatively evaluates selected accident scenarios by considering their frequencies and consequences.
What is the difference between LOPA and QRA?
LOPA is a semi quantitative method focused on defined cause consequence scenarios and independent protection layers. QRA generally considers a broader set of scenarios and provides a more detailed quantitative estimate of risk.
What is individual risk in QRA?
Individual risk represents the estimated risk to an individual at a specified location from the hazardous activities being assessed. It is commonly presented using risk contours.
What is societal risk in QRA?
Societal risk describes the relationship between accident frequency and the potential number of fatalities or affected people. It is commonly represented using an F N curve.
Does every QRA require risk contours?
No. The outputs required depend on the purpose and scope of the assessment. HSE guidance specifically notes that quantitative assessment does not necessarily require full isorisk contour and F N curve analysis in every situation.
Can QRA predict an accident?
No. QRA does not predict exactly when an accident will occur. It estimates risk using defined scenarios, frequency data, consequence models and assumptions.
What software is used for QRA?
Different QRA tools can be used for consequence modelling, dispersion, reliability analysis, event trees, risk calculations and geographic risk presentation. Software selection should follow the study methodology and requirements rather than determine them.
When should QRA be performed?
QRA may be performed during concept development, FEED, detailed design, modifications or operations depending on the facility hazards and the decision being evaluated.
Key Takeaway
A Quantitative Risk Assessment is not simply a software exercise and it is not just a collection of consequence contours.
It is a structured engineering analysis that connects:
Hazard scenarios → Frequencies → Consequences → Exposure → Risk → Risk reduction
The most useful QRA is therefore not necessarily the one containing the most complicated models.
It is the one that:
- starts with a clearly defined decision
- uses credible scenarios
- applies appropriate frequency data
- uses technically defensible consequence models
- makes assumptions transparent
- represents exposure appropriately
- communicates uncertainty
- identifies the dominant contributors to risk
- and helps the organisation make better risk informed decisions
When integrated with PHA, HAZOP, LOPA, Functional Safety and Process Safety Management, QRA becomes part of a broader risk management framework rather than an isolated calculation.
How INDSAFE supports QRA and Dispersion Modelling
INDSAFE provides QRA and Dispersion Modelling as part of its process safety services.
A QRA study can be structured around the specific facility, hazardous materials, process conditions, site characteristics and assessment objectives. Depending on the study scope, this can involve scenario identification, frequency assessment, consequence modelling, dispersion analysis, fire and explosion consequence assessment, risk estimation and evaluation of risk reduction measures.
The objective is not simply to generate numerical results.
It is to convert complex process hazard information into clear, decision useful risk insight.
For projects where QRA is required, the assessment should be developed using an appropriate methodology, documented assumptions, relevant engineering data and recognised process safety practices.
Need to understand the risk profile of an existing or proposed facility? Talk to INDSAFE about QRA and Dispersion Modelling.
Technical References
- Center for Chemical Process Safety (CCPS), AIChE: Guidelines for Chemical Process Quantitative Risk Analysis, 2nd Edition. The CCPS guidance covers chemical process quantitative risk analysis, consequence analysis, event probability and failure frequency analysis, risk estimation and presentation, databases, special techniques and application examples.
- CCPS, AIChE: Risk Analysis Screening Tool and Chemical Hazard Engineering Fundamentals. The CCPS framework illustrates the relationship between hazard identification, scenario development, consequence evaluation, semi quantitative LOPA and QRA.
- CCPS, AIChE: Process safety risk assessment guidance and LOPA resources.
- UK Health and Safety Executive (HSE): Guidance on proportionality and quantitative risk assessment for major hazard facilities.